- Visualize Justice
- Posts
- Visualize Justice: What happens with a bias crime?
Visualize Justice: What happens with a bias crime?
And are bias crime convictions increasing?
Ann Leymon
January 15, 2026

What happens with a bias crime?
Since we are visualizing justice in this newsletter, we can’t end this series without talking about how a bias crime works its way through the criminal justice system. We’ll also check out whether bias crimes are trending up or down over the last five years.
Welcome to Visualize Justice: Dataviz insights to illuminate the justice system. Here I use 10+ years of experience in research to make the complicated justice system, and the complexities of its data, easier to understand. The better we understand what’s actually happening, the clearer we are about how we can make our communities safer and do less harm.
What happens after an arrest for a bias crime?
After a case is referred for prosecution, several outcomes are possible. This is the main focus of this chart, shown by the skinny blue bars. The total number of cases sent to prosecutors has almost doubled over the last 5 years, shown by the top dark blue line (from cross-system data*). This could be the result of more bias crimes, or a shift in policing policy.
The number of convictions** has stayed virtually the same since 2021. In 2024, there are more pending cases, which isn’t surprising – this just means they’re still working their way through the courts. It can take a long time.
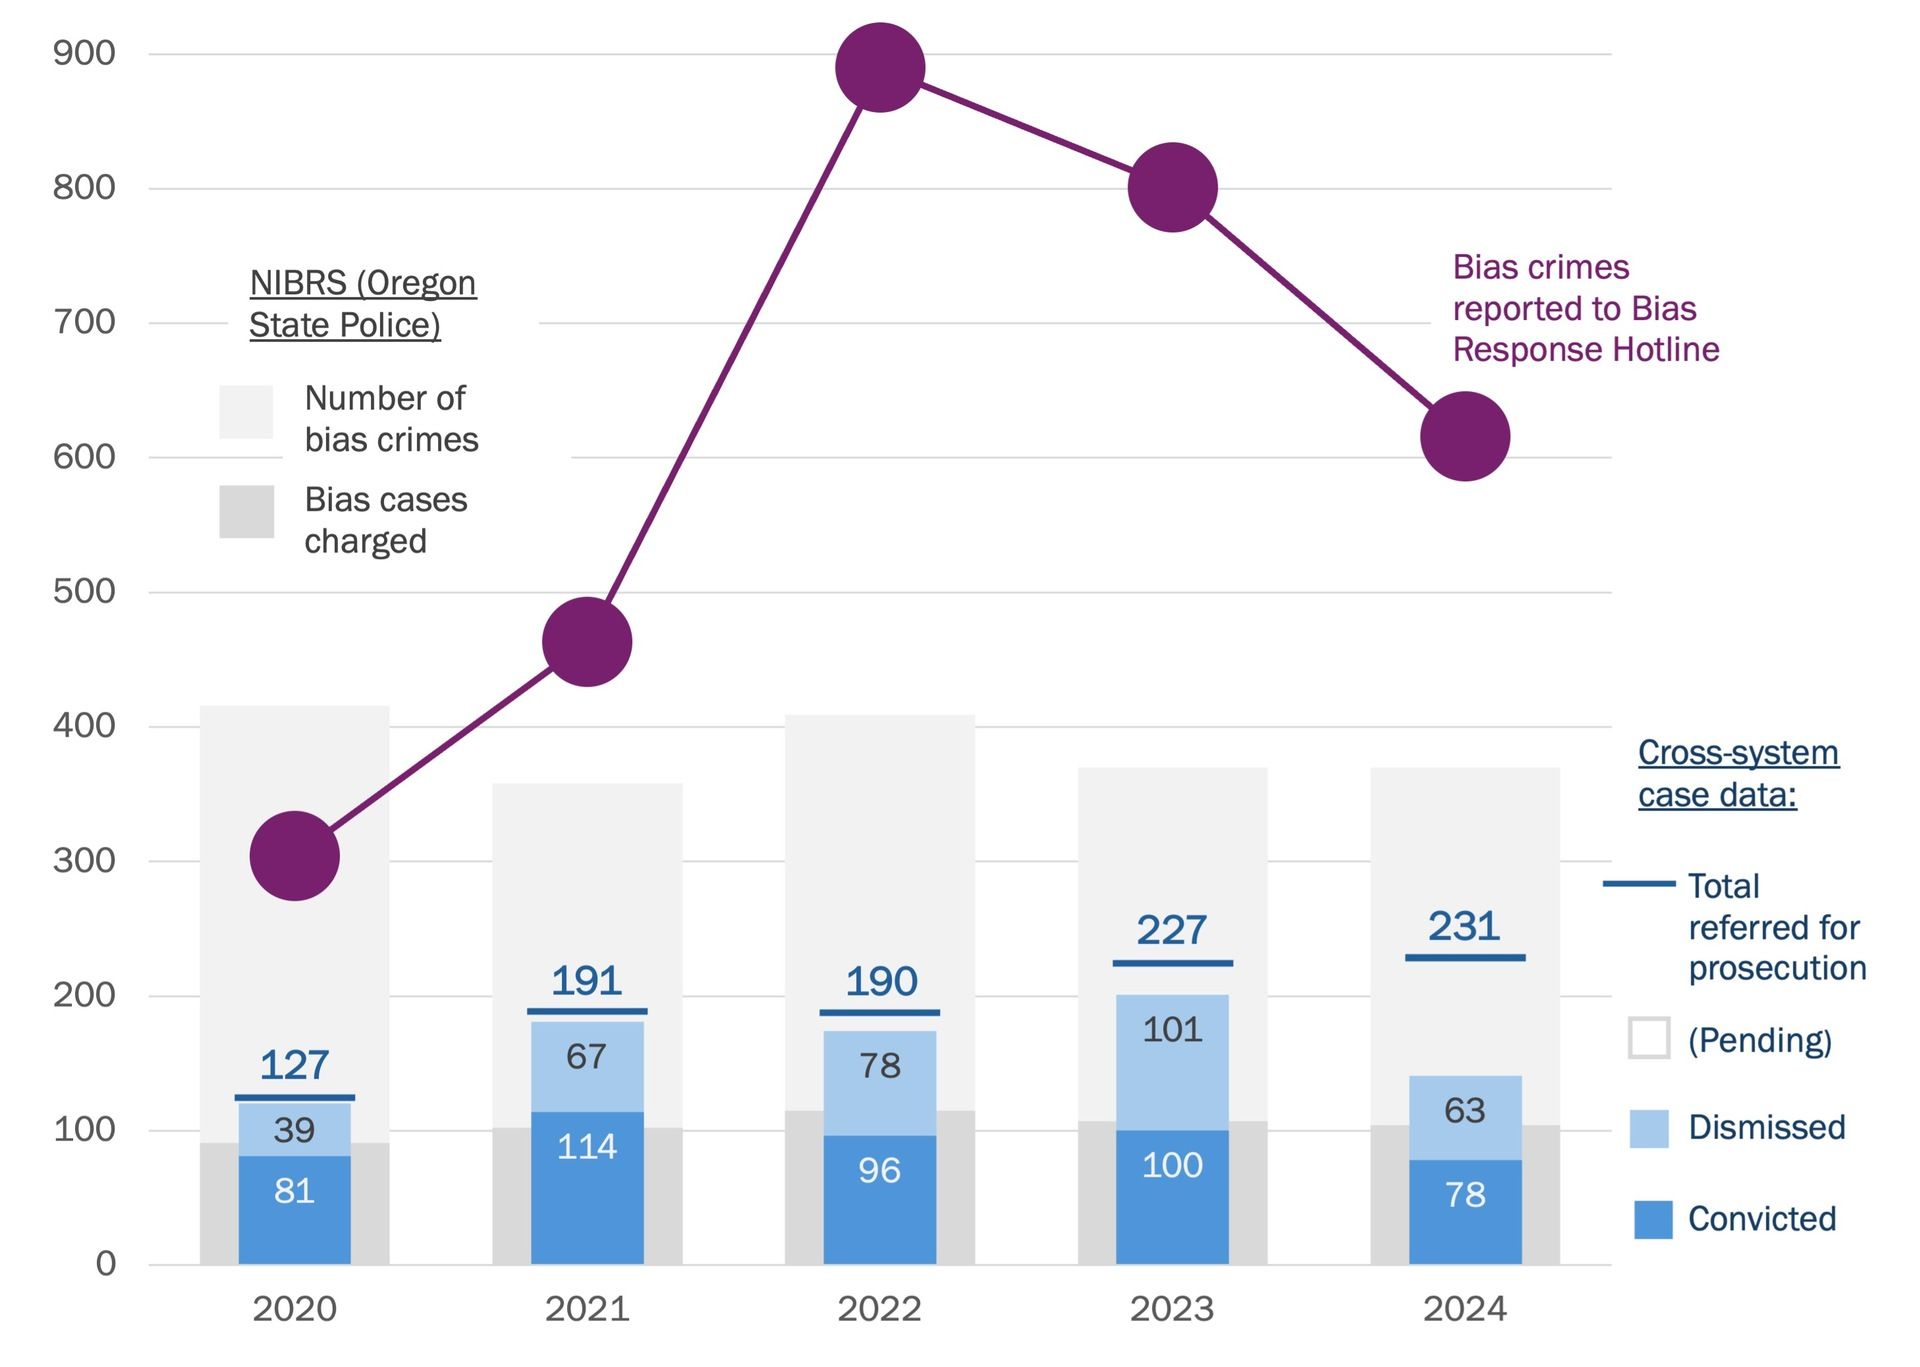
Dismissed cases more than doubled from 2020-2023. This includes cases the prosecutors chose not to pursue. The increase in referrals may have been driven by weaker cases. It’s also possible that prosecutors’ offices were not able to adjust workloads and policies to absorb additional cases of this specific nature.
Worth noting: A small number of the dismissed cases resolved through civil compromise, a process that centers repairing harm and accountability through facilitated mutual agreement between victim and offender.
Behind the blue bars are thicker grey bars that don’t change much over this time period. This is NIBRS data (from the Oregon State Police), the primary official source of bias crime data in Oregon. In this data it doesn’t look like there’s been an increase - though that’s not what the other sources show.
The darker grey is the number of accused who are formally charged with a bias crime. In recent years, NIBRS has records of less than half the total cases charged in the criminal justice system.
The lighter grey bar is the total cases recorded in NIBRS; you can see that the majority of cases do not end up with formal charges.
Finally, the purple dots show that since 2020 the Bias Response Hotline (BRH) has received far more reports of bias crimes than the other sources, though they are potentially starting to converge (data and full report here).
The last point I want to make is that we have multiple separate data systems, that don’t work together. Theoretically we should be able to link case records from arrest to conviction to sentencing to get a really good sense of how people move through the system, but we really can only do that in very limited ways.
In Oregon we have well over 100 police agencies, 36 DAs offices, and nine tribal courts and prosecutors. Each office uses multiple systems for administratively tracking and reporting their work. Those records become the data we use to try and answer questions about what is happening and how well the justice system is working. It’s far from perfect and there are things we could do to improve the data right now.
This is the final edition in this series on bias crimes and incidents in Oregon, though there is more to say (there are several scholars who have devoted their entire careers to this topic alone - write back and let me know if you want recommendations). I hope this glimpse of what bias, bias crime case processing, and criminal justice data look like in Oregon has been helpful for you.
Stayed tuned for next month - we’ll start looking at recidivism. Do people who are serving a sentence commit more crime or less crime?
*Cross-system data: The CJC combed LEDS (police data), Odyssey (court data), and DOC (felony sentence) data to find individuals charged, arrested, referred, or sentenced with a bias crime. (Bias I or Bias II). Using unique identifiers, they created a dataset that allows tracking across the system.
**This includes both bias convictions and non-bias convictions, in cases where the initial charge had a bias crime.
This newsletter is for busy people who care about justice and want to understand it.
Does that sound like someone you know? I’d appreciate it if you forwarded this on to them.
What do you think about this topic and my main points? Write me back or schedule a time to chat.
Let’s keep working for a more peaceful system.
Kindly,
Ann
Here are a few ways to get more data support from me:
Subscribe and get my newsletter delivered to your inbox, or follow me on LinkedIn.
Book a free 30-minute consultation with me to talk about all things data.
Learn about Research on Retainer, where I bring my high-level research expertise to advise you on ways to improve data collection and analysis, interpret research to build understanding and strengthen your decision-making, refine how you present data for clearer messaging, and more.
Did a colleague forward you this email? Click the button below to receive the next one!