- Visualize Justice
- Posts
- Visualize Justice: Do young people experience more antisemitism?
Visualize Justice: Do young people experience more antisemitism?
And, what is the lowest threshold for a bias incident?
Ann Leymon
November 20, 2025

Do young people experience more antisemitism?
The last two newsletters in the Bias Response Hotline (BRH) series have focused on race, but it’s not the only type of bias, is it? (Catching up? See past newsletters here). Let’s look at all types of bias tracked in the BRH. We’ll look at them through the lens of the victim’s age, just to see things from another angle.
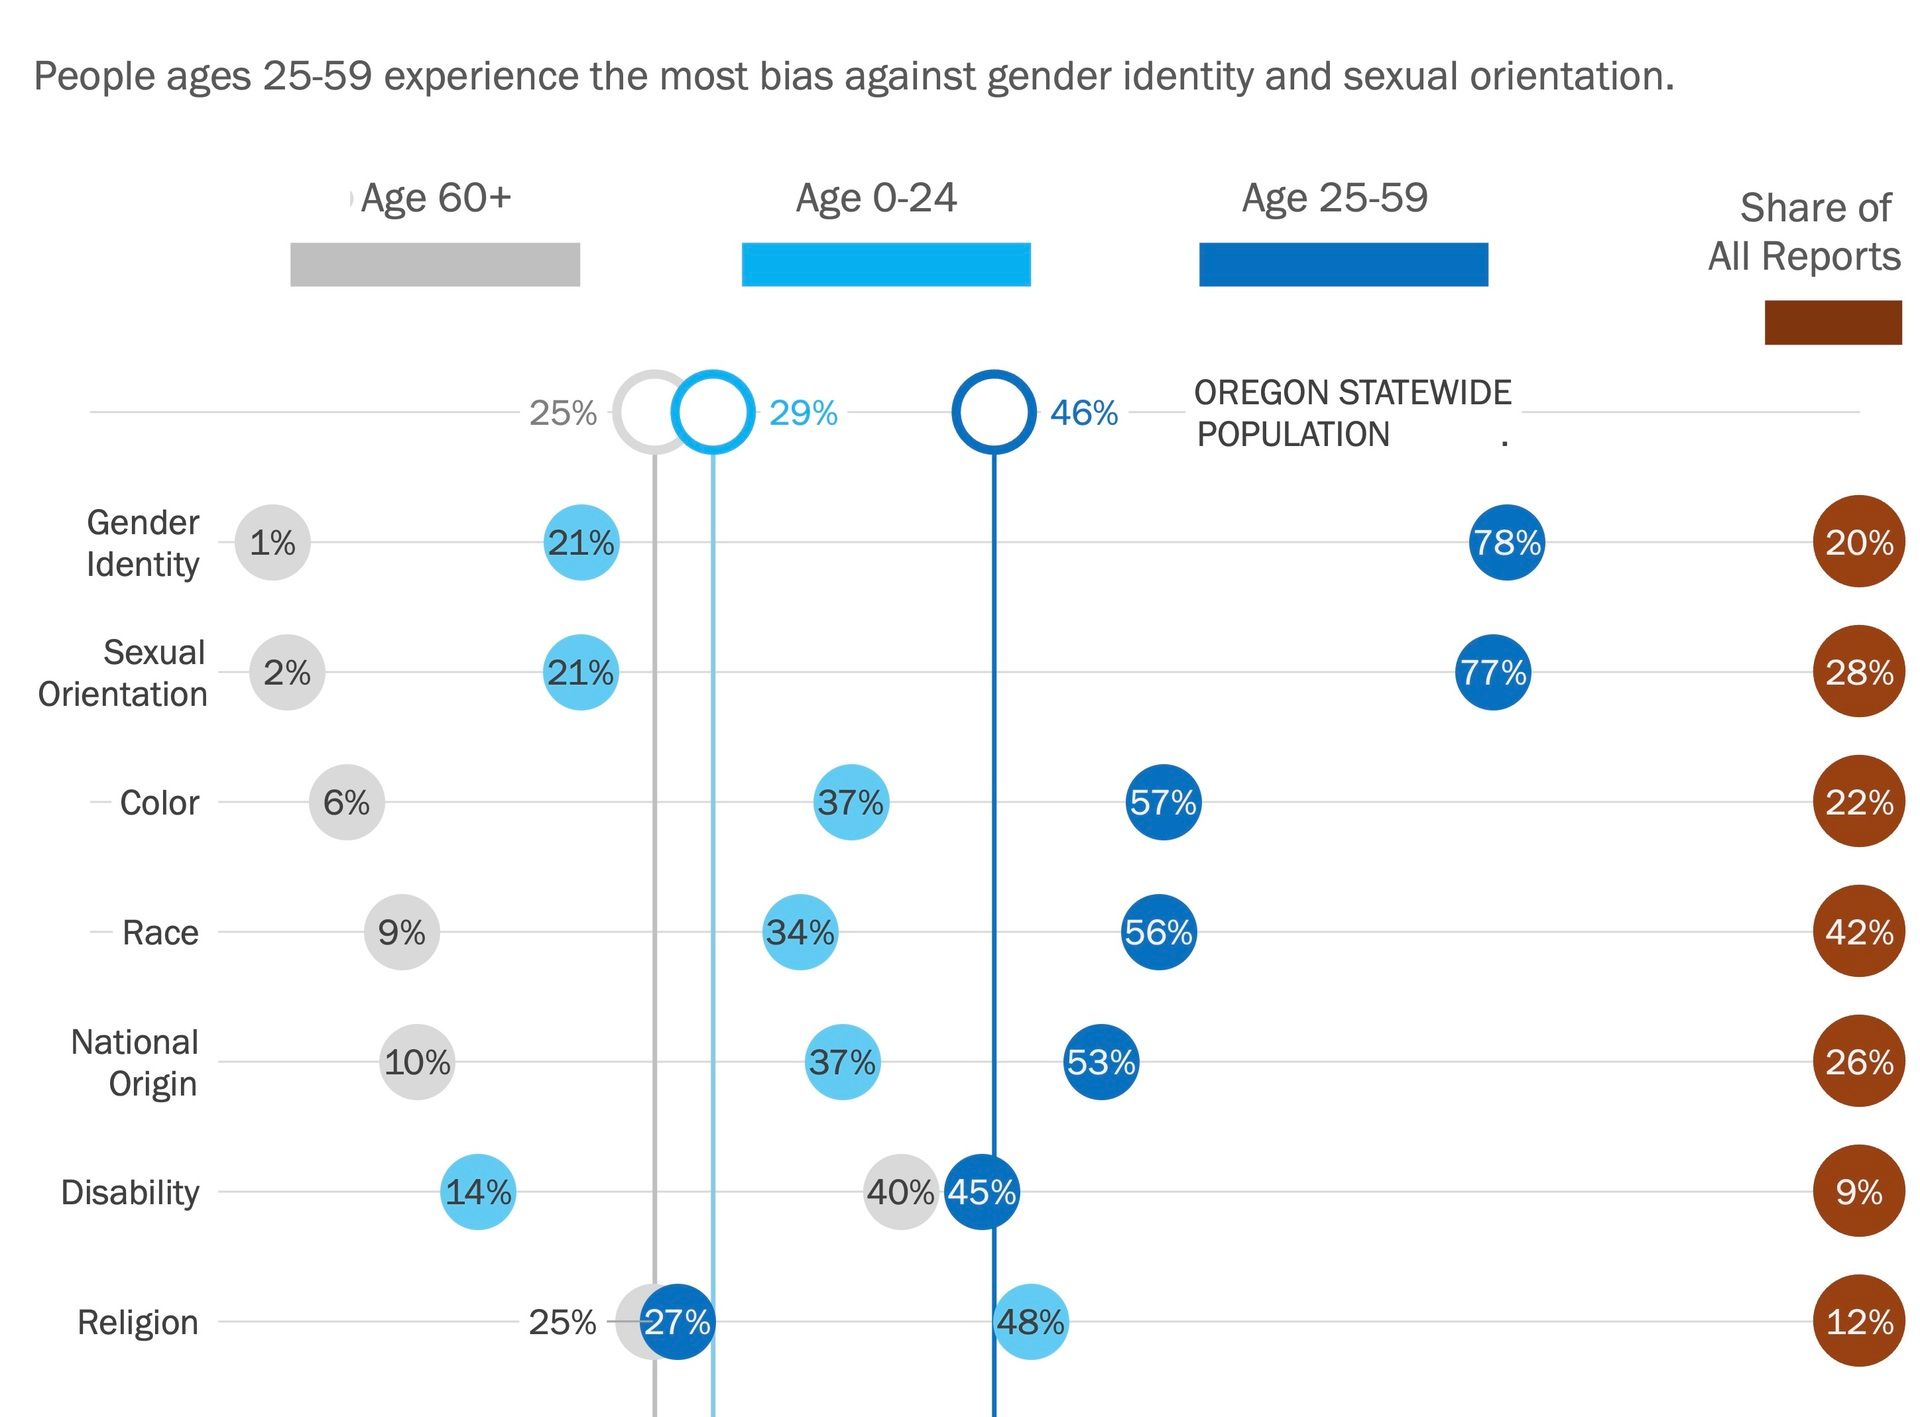
Not news, but still important - race is the most common type of bias in every age group. The dark reddish orange circles on the right show the overall percentage of reports by category (reports can be in more than one category, so this adds up to more than 100%).
Welcome to Visualize Justice: Dataviz insights to illuminate the justice system. Here I use 10+ years of experience in research to make the complicated justice system, and the complexities of its data, easier to understand. The better we understand what’s actually happening, the clearer we are about how we can make our communities safer and do less harm.
Within each bias category, we’re looking at the breakdown by victim’s age.
In the BRH data, anti-disability bias skews high for folks 60 and older. Disability bias is pretty evenly divided between mental and physical disabilities.
Overall, this age group is underrepresented as bias victims in the hotline data; they account for 12% of BRH victims despite being 25% of the Oregon population.
Middle age (25-59) people show up more as sexual orientation and gender identity bias victims. They also are mildly overrepresented altogether as victims of bias crimes, accounting for about 57% of reports, though they are 46% of Oregon’s population.
Finally, religious bias is above baseline for young people (0-24). Most religious bias reports are anti-Jewish.
This brings me to my fifth point. After I look at the basic stats in the data, I look beyond the stats to evaluate accuracy. How well does this data reflect the reality of bias crimes in Oregon?
Do young people experience more anti-semitism than grown-ups, or is this data collection skewed in a specific way?
Here’s what I found: In a discussion of how they categorize incomplete reports, the BRH report describes receiving reports of a confederate flag or a swastika on a car in a school parking lot. This is categorized as a bias incident.
Now, these symbols can represent multiple types of biases. If the person making the report didn’t specify, BRH has a policy to code them in specific ways. Reports of swastikas are categorized as anti-Jewish religion bias. Reports of Confederate flags are coded as anti-Black race bias and color bias.
This is a bit of a problem for a few reasons.
When we look at the data, we don’t know how many reports were incomplete. It could be just a few reports, or it could be most of them. A footnote with this information would go a long way.
This means that the category of “bias incident” is quite broad; it includes not only incidents like slurs, but also the presence of symbols without interaction or targeting.
Theoretically, a single flag could be seen and reported by several people, potentially inflating the data to overshadow other incidents and other types of bias.
Overall, this makes it harder to draw strong conclusions from the data. A simple fix would be splitting “bias incidents” into two categories, based on whether there was interaction. There’s value to tracking hate symbols, and doing so would give us a clearer and more nuanced picture of biased behavior in Oregon.
This newsletter is for busy people who care about justice and want to understand it.
Does that sound like someone you know? I’d appreciate it if you forwarded this on to them.
What do you think about this topic and my main points? Write me back or schedule a time to chat.
Let’s keep working for a more peaceful system.
Kindly,
Ann
Here are a few ways to get more data support from me:
Subscribe and get my newsletter delivered to your inbox, or follow me on LinkedIn.
Book a free 30-minute consultation with me to talk about all things data.
Learn about Research on Retainer, where I bring my high-level research expertise to advise you on ways to improve data collection and analysis, interpret research to build understanding and strengthen your decision-making, refine how you present data for clearer messaging, and more.
Did a colleague forward you this email? Click the button below to receive the next one!